It is a common saying that all models are wrong but some models are useful. In that spirit this article investigates the accuracy of the Rigorous Coupled Wave analysis (RCWA) methods implemented in the PlanOpSim software. A comparison is made to the widely known finite difference time domain (FDTD) method.
- Convergence checks to determine which settings give reliable results
- Benchmark Comparison for the transmission and phase delay of a cylindrical nano-rod.
Meta-surfaces rely on sub-wavelength structures to manipulate light in different ways such as phase delay, polarization conversion, specific dispersion. The design of these structures requires a full solution of Maxwell’s equations in three dimensions.
For such sub-wavelength calculations there are (in general) no exact solutions. Their design is thus done by numerical method, known as full-wave solvers. Some of the most common methods are FEM, FDTD and RCWA.
A common question with any simulation method is whether the calculation produces physically accurate results. Since exact solutions are not known for the sub-wavelength structures that make up a meta-atom, a validation is performed by comparing the results of different methods.
FDTD and RCWA both model the same underlying physical laws. However both solve the Maxwell equations via a different mathematical and numerical approach. In FDTD the Maxwell equations are discretized directly in both time and space. RCWA first transforms the equations to the frequency domain (both time-frequency and spatial frequency). Nevertheless, the solutions found by both methods should be the same.
Benchmark Case
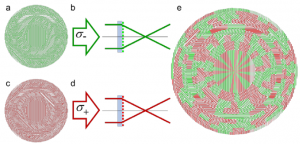
Many meta-surface use sub-wavelength cylinders as the basic building block for the metasurface ([1]). The pillars are made of a high refractive index material. In addition, the material should be transparent for the spectrum of interest. Common choices are SiN, GaN or TiO2 for the visible spectrum and Si and GaAs for the infra-red spectrum. The figure below shows a meta-lens consisting of such dielectric nano-rods.
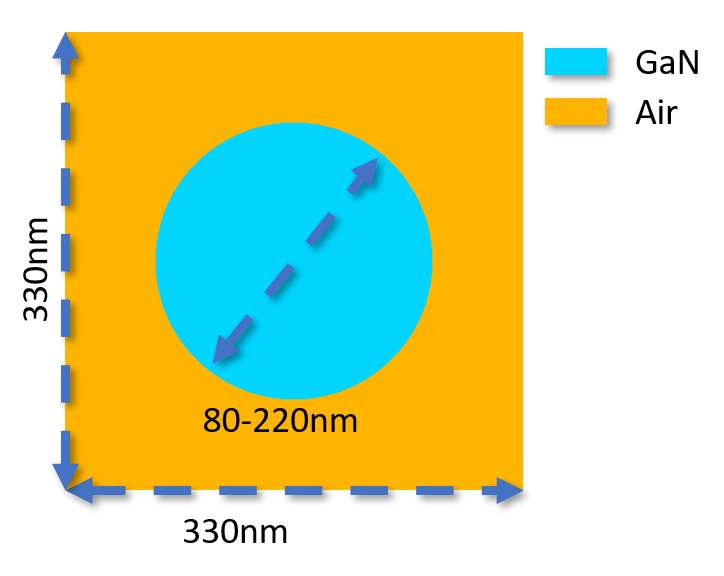
For this benchmark we use a GaN pillar on a SiO2 substrate. The pillars are 460nm high and separated with a pitch of 330nm in a square periodic arrangement. In many meta-surfaces the goal of the meta-atom design is to find a range of structure parameters who cause different phase delays (from -180 to +180°) while also being highly transmissive.
In this example we obtain this behaviour by modifying the radius of the cylinder while keeping all other parameters (most importantly the height) fixed. The incident light is set at normal incidence and a wavelength of 460nm. The polarization is set to TM, although the result will be the same for TE given the symmetry of the problem. Periodic boundary conditions are applied.
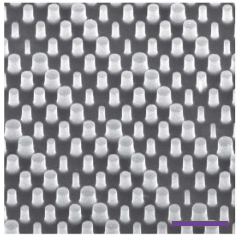
The figure below is the top-view of the simulated nano-pillar for a diameter of 200nm. These configurations were defined in PlanOpSim[2] and MEEP [3] for comparison.
Convergence
In any electromagnetic simulation there will be some discretization involved, due to the fact that we are solving a continuous system on a computer. This can cause discretization errors even if the calculation itself implements the physical laws without any approximations like in full wave solvers.
In practice the appropriate discretization level is determined by a convergence test. That is to simulate the same configuration with increasingly small discretization steps until the calculation result no longer changes. The discretization can then be set to the level which gives an acceptable deviation from the converged result.
For this validation, a convergence test was done for the FDTD calculation and the RCWA calculation. In the case of RCWA the controlling parameter is the truncation of the spatial frequency series (determined by the Accuracy setting). In FDTD the resolution is controlled by the spatial step size in three dimensions x, y, and z (The stepsize in time is derived from the spatial discretization stepsize).
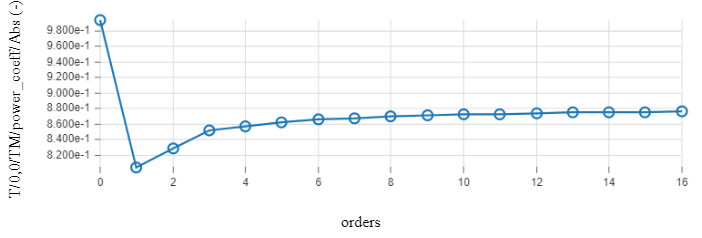
The figure below shows the convergence test for both the RCWA and FDTD calculation for the 140nm diameter nano-pillar. For RCWA we see that the simulated transmittance changes differ depending on the number of orders (frequency components) in the calculation. For higher number of orders, the result becomes stable. From here on the RCWA calculations in this article are done with the orders setting at 13. At this number of orders the result has converged and further increases in the settings have little influence on the simulation result.
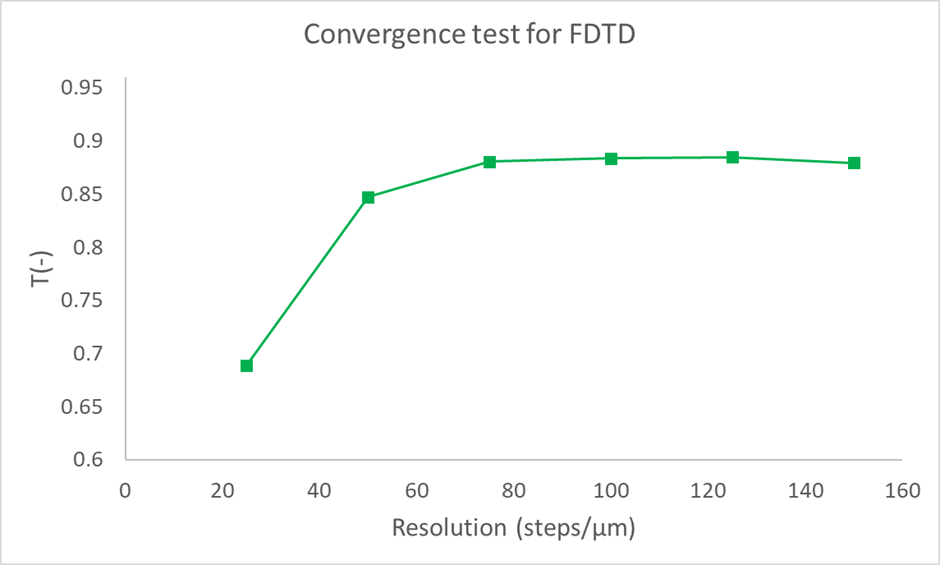
A similar procedure is executed for FDTD, where the resolution in steps per µm was increased from 25 to 150. The configuration is the same as above. The figure below shows the simulated transmission. We see that the FDTD results no longer show any significant change in simulated transmission for resolutions of 75 steps per µm and up. In the following calculations a resolution setting of 150 steps per µm was used.
Results
Now that we have determined the appropriate settings for the RCWA and FDTD calculation, we can perform the actual benchmark calculation. We now vary the diameter of the nano-pillar from 80 to 220 nanometer with both the RCWA and FDTD software. In a single frequency calculation like this one, the RCWA calculation will be much faster because it is naturally suited to single frequency calculations. Time domain methods automatically calculate multiple frequencies, but the downside is that this calculation will be slower when only a few wavelengths are of interest (for more details on the simulation speed check this article).
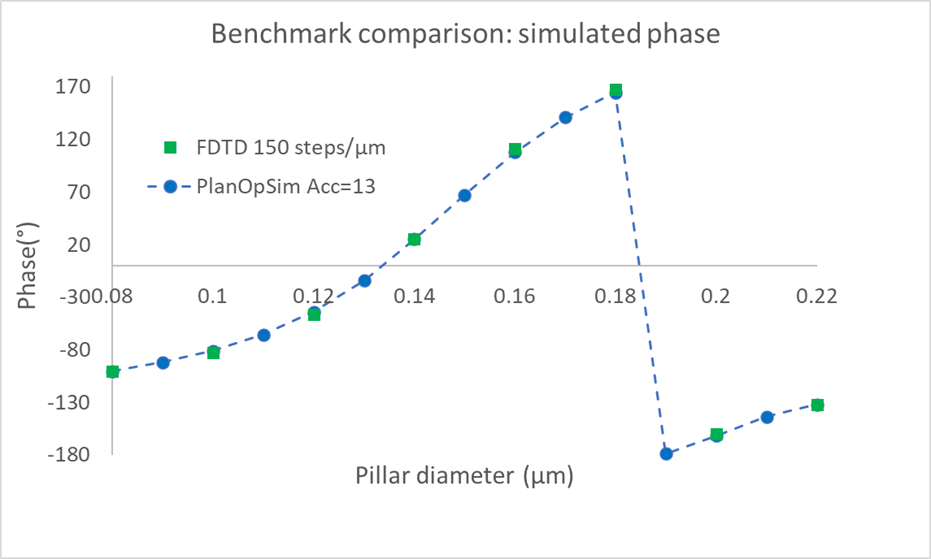
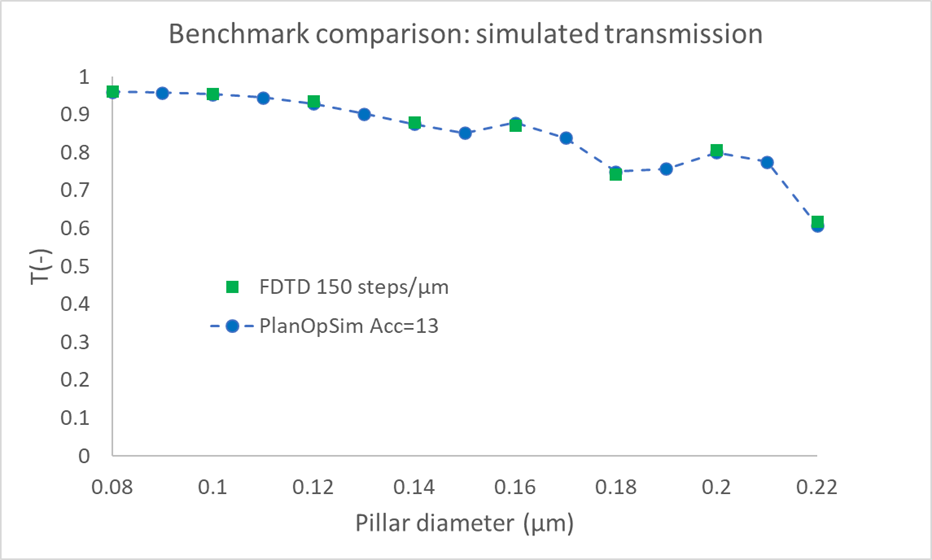
Upon comparing the simulated phase delay (figure above) we find that the simulated phase delay is the same for both methods. The maximum discrepancy in simulated phase was 3.2°, with a root mean square (RMS) of 2°. Similarly, the transmitted power simulation gives the same results for both methods. The maximum discrepancy in calculated transmission was 1% with an RMS discrepancy of 0.65%.
This benchmark demonstrates that both the PlanOpSim software and FDTD are equally accurate solvers for meta-surface design, however the RCWA method is much faster in reaching these results.
References
[1] A. Arbabi, E. Arbabi, S. M. Kamali, Y. Horie, S. Han, and A. Faraon, “Miniature optical planar camera based on a wide-angle metasurface doublet corrected for monochromatic aberrations,” Nat. Commun., vol. 7, pp. 1–9, 2016.
[2] “Commercial software by PlanOpSim NV (www.planopsim.com).” .
[3] “MEEP open software.(https://meep.readthedocs.io/en/latest/)” .